I'd like to share my experience in BW reporting via this "Tips" series; now the tip 1 is "Do not let the figure fool your eyes". After writing this title down, I doubt about its ambiguity immediately, so I change it to "drill down level/sequence reveals the secret"; anyway it is just a title, let us leave it along.
I will use an example to show you my point:
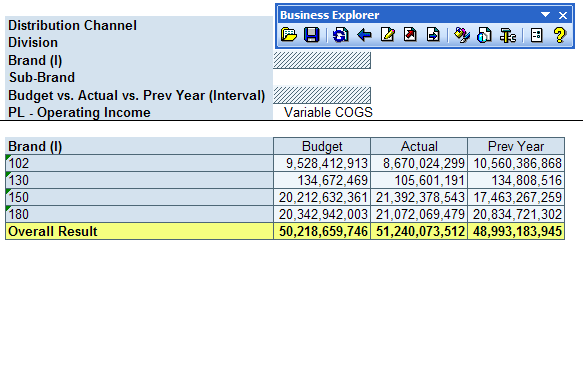
1. I have a BW report as shown below:
2. If I a). Swap Brand(I) with "Budget vs. Actual vs. Prev Year";
b). Filter "Budget vs. Actual vs. Prev Year" with "Actual";
c). Drill down to "Distribution Channel";

3. However if from step 1, I drill down to Distribution Channel directly, and then swap it with "Brand(I)", bingo! we find another world!

So why this happened? If you notice, in "Actual" column, the unsaaigned Brand(I) "#" total for all Distribution channels is zero, and the total of Distribution Channel "#" is zero as well. In step 2, actually it aggragated the data by Brand(I) and Distribution Channel, unassigned data did come out since total is zero.
You also can find them out in the Cube and DataSource.
OK, time to say good-bye, hope you enjoy the tip1!
posted on 2005-11-07 00:58
Jonathan Ji 阅读(445)
评论(0) 编辑 收藏 引用