===http://motevich.blogspot.com/2007/08/how-to-detect-memory-leaks-with.html
===Great Work!
Today, I plan to share my experience on the memory leaks detecting. This article is a step-by-step instruction on how to use HP/Mercury LoadRunner to perform load testing for the purpose of memory leaks discovering.
The task:
It needs perform testing of Web server to discover memory leaks.
The solution:
- Create LoadRunner VuGen scrīpt for your application (Web server in my scrīpt)
Let's suppose, we have done it:
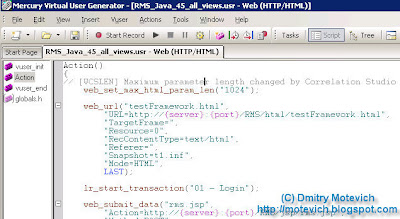
Actually, I will explain different tricks and features of VuGen scrīpts in the further posts.
- Create LoadRunner Controller scenario for your application using the VuGen scrīpts.
Here it is:

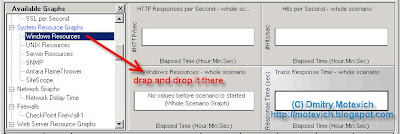
- The next step is to add measurement monitors which are quantitative indicators of resources being monitored (for example, memory usage, CPU usage, handle and thread count, and so on).
For that, on "Run" tab in the LoadRunner Controller, drag "Windows Resources" item from the "Available Graphs" tree and drop it to graphs area.
See the screenshot:
Then right-click on the just added graph ("Windows Resources") and select "Add Measurements" from the pop-up menu.
"Windows Resources" dialog will be shown:
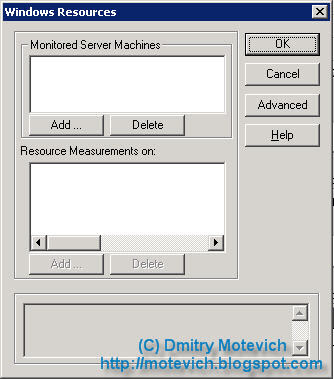
The following actions are easy. I will add the name of server where the application (Web server in my case) will be run. This server can be a remote one. In this case, you have to make sure that LoadRunner will have an access to get info from the remote computer. Usually, I provide administrator rights for user which executes LR scrīpts.
After that I select counters I want to measure during the load testing:
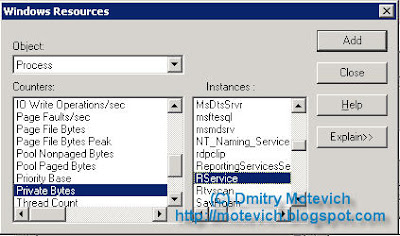
So, "Windows Resources" dialog looks like:
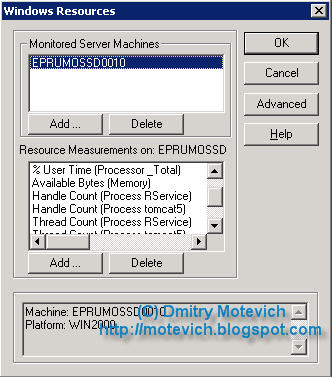
I selected the following counters:
- % User Time for two processes (RService & tomcat5) and the whole system (_Total)
- Available bytes in the system
- Handle counts
- Thread counts
- Working Sets
Also you may wish to add "Private Bytes" counter. Descrīption for each counter is available on "Windows Resources" dialog. Obviously that the set of counters depends on the requirements and software to be tested.
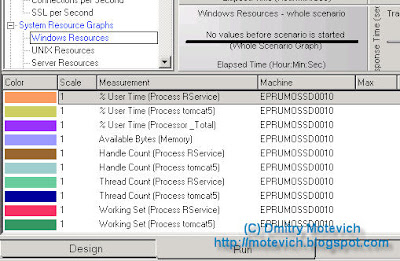
Pay attention... If you select the "Windows Resources" graph, the list of counters will be shown in the lower part of the LoadRunner Controller:
- Our mission is almost complete :) We have to run the scenario against a number of concurrent users (I user 30 users) and observe the graph displaying info on memory, CPU, handles and so on...
I will show the result graph after 4 hrs of execution:
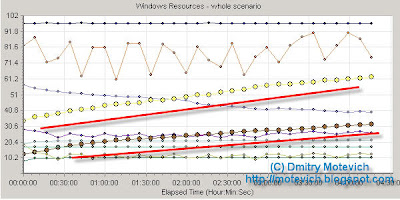
Pay attention to the yellow dotted line (memory usage of "RService" process) and the brown dotted line (habdle count counsumed by "RService" process) trends. They grow constantly during ~ 4.5 hours. I marked them out with red lines.
So, this graph provides proofs that the application, I tested, contains memory leaks in the "RService" process.
Several words about useful tricks and hints, connected to measurements ans graphs:
- It is possible to export graphs to HTML from the LR. For that, right-click on the graph and select "Export to HTML...". It will generate HTML report containing the graph and a legenda for it. Very useful feature :)
- I recommend to set the range of time to be shown on the graph, to "Relative to scenario start". To perform this, right-click on the graph and select "Configure...". That allow to display statistics for the whole execution, but the latest N minutes.
- Sometimes, it is convenient to show more detailed graph. For that, double click on the graph - one big graph will be shown. To revert, double-click again. Also, you can change the number of graphs displayed - open menu View/View Graphs and set the required number.
- So, now Dev team has to fix the problem in the "RService" process.. The last graph shows the results of load testing perfomed on the fixed application:
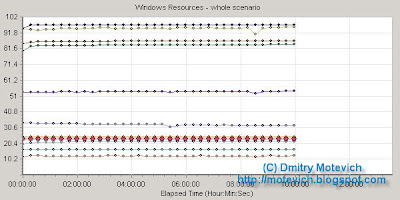
No any memory leaks found during 10 hrs.
Memory leaks fixed! Isn't it a progress? :)
I hope, my explanation will be helpfull for you :)
Please, share your comments and thoughts. Ideas for further topics - welcome :)
Dmitry Motevich,
QA / Automated testing specialist