Introduction
Traditionally, the UML has been associated more with software engineering and systems design than with analysis and modeling of business processes. However, standard UML 2.x provides a rich set of behavioral models which are very useful in modeling the processes, activities, people and information critical to every business.
Beyond the standard UML notation, two well respected and proven UML “extensions” exist which further enhance the capturing of business process and related constructs. The first is Business Process Modeling Notation (BPMN), which has gained enormous popularity and is rapidly becoming a new standard for modeling and designing business processes. The second is the Ericsson-Penker profile which has less popularity, but still provides a unique and powerful means of visualizing and communicating business processes and the necessary flow of information within an organization.
This paper provides a very high-level introduction to both of these “extensions”, showing how they can be used in Enterprise Architect and some of the common modeling constructs they use.
Business Process Modeling Notation (BPMN)
BPMN defines a Business Process Diagram (BPD), which is based on a flowcharting technique tailored for creating graphical models of business process operations. It is a notation that is readily understandable by all business users, from the business analysts that create the initial drafts of the processes, to the technical developers responsible for implementing the technology that will perform those processes, and finally, to the business people who will manage and monitor those processes.
A BPMN model consists of simple diagrams with a small set of graphical elements.
Flow Elements
- Activities. An activity is work that is performed within a business process and is represented by a rounded rectangle.
- Events. An event is something that happens during the course of a business process which affects the sequence or timing of activities of a process. Events are represented as small circles with different boundaries to distinguish start events (thin black line), intermediate events (double line) and end events (thick black line). Events can show icons within their shape to identify the trigger or result of the event.
- Gateways. Gateways are used to control how sequence flows converge and diverge within a process. Gateways can represent decisions, where one or more paths are disallowed, or they can represent concurrent forks.
- Sequence flows. A sequence flow is used to show the order in which activities are performed within a process. A sequence flow is represented by a line with a solid arrowhead.
- Message flows. A message flow is used to show the flow of messages between two entities, where pools are used to represent entities. A message flow is represented by a dashed line with a light-colored circle at the source and arrowhead at the target.
- Associations. An association is used to associate information and artifacts with flow objects. An association is represented by a dashed line which may or may not have a line arrowhead at the target end if there is a reason to show directionality.
Swimlanes (Partitions)
- Pools. A pool represents a participant in a process, where a participant may be a business entity or role. It is represented as a partition of the process.
- Lanes. A lane is a sub-division of a pool and is used to organize and categorize activities within the pool.
Artifacts
- Data objects. A data object does not have a direct affect on a process but does provide information relevant to the process. It is represented as a rectangle with the top corner folded over.
- Groups. A group is an informal means for grouping elements of a process. It is represented as a rectangle with a dashed line border.
- Annotations. An annotation is a mechanism for the BPMN modeler to provide additional information to the audience of a BPMN diagram. It is represented by an open rectangle containing the annotation text.
BPMN Examples
Example 1:
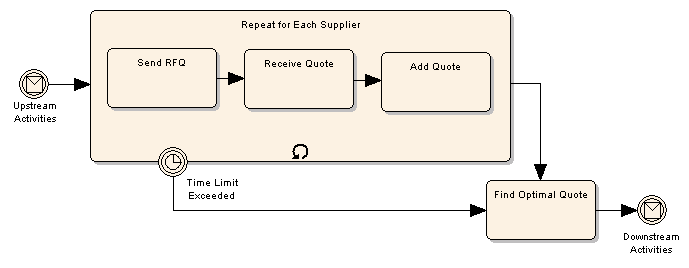
The above diagram illustrates a number of key features of BPMN, specifically the ability to create hierarchical decomposition of processes into smaller tasks, the ability to represent looping constructs and the ability to have external events interrupt the normal process flow.
"Upstream Activities" and "Downstream Activities" are link-triggered intermediate events; in other words, off-page connectors.
"Repeat for Each Supplier" is a looping activity, which repeats its three contained activities either once for each supplier or until a time limit is exceeded. The intermediate event mounted on the lower edge of the activity is a time-triggered event.
Example 2:
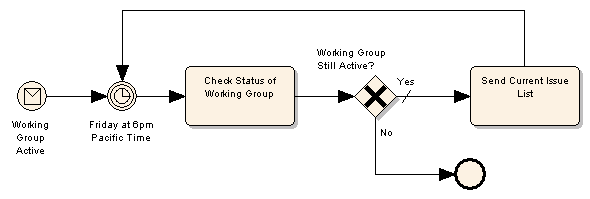
The above diagram shows a process being initiated by an event - in this case a message-triggered start event which notifies the process that the working group is active. The diagram also shows a loop being controlled by a timer event, and it shows a decision gateway (in this case, an XOR decision gateway) controlling when the loop is terminated.
Example 3:
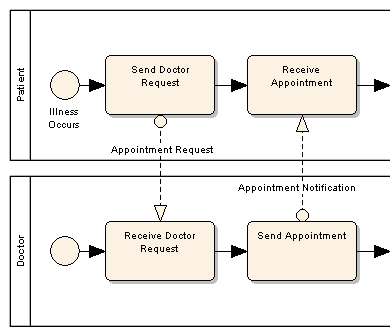
This diagram illustrates the use of pools to show interacting processes and the way that messages are passed between pools using message flow connectors.
Eriksson-Penker Business Modeling Profile
This section provides an introduction to the terminology and icons used in the Business Process Model, and gives a quick introduction to some Unified Modeling Language (UML) concepts and how they are applied in Enterprise Architect's Business Process Model.
A business process:
- Has a Goal
- Has specific inputs
- Has specific outputs
- Uses resources
- Has a number of activities that are performed in some order
- May affect more than one organizational unit. Horizontal organizational impact
- Creates value of some kind for the customer. The customer may be internal or external.
Process Models
A business process is a collection of activities designed to produce a specific output for a particular customer or market. It implies a strong emphasis on how the work is done within an organization, in contrast to a product's focus on what a process is. Thus a specific ordering of work activities across time and place, with a beginning, an end, and clearly defined inputs and outputs: a structure for action.
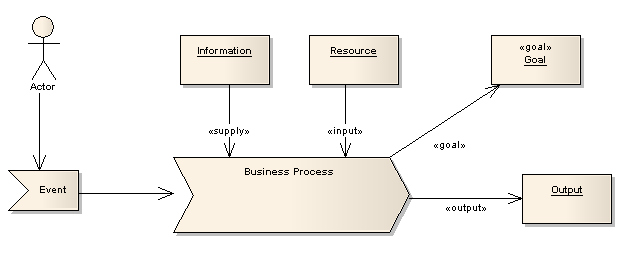
Supply link from object Information. A supply link indicates that the information or object linked to the process is not used up in the processing phase. For example, order templates may be used over and over to provide new orders of a certain style – the templates are not altered or exhausted as part of this activity.
- Supply link from object Resource. An input link indicates that the attached object or resource is consumed in the processing procedure. As an example, as customer orders are processed they are completed and signed off, and typically are used only once per unique resource (order).
- Goal link to object Goal. A goal link indicates the attached object to the business process describes the goal of the process. A goal is the business justification for performing the activity.
- Object flow link to object Output
- Object flow link from event Event. An object flow link indicates some object is passed into a business process. It captures the passing of control to another entity or process, with the implied passing of state or information from activity to activity.
Goal
A business process has some well defined goal. This is the reason the organization does this work, and should be defined in terms of the benefits this process has for the organization as a whole and in satisfying the business needs.
Goals link to Processes. A Goal link indicates the attached object to the business process describes the goal of the process. A goal is the business justification for performing the activity.
Information
Business processes use information to tailor or complete their activities. Information, unlike resources, is not consumed in the process – rather it is used as part of the transformation process. Information may come from external sources, from customers, from internal organizational units and may even be the product of other processes.
Information items link to Business Processes. A Supply link indicates that the information or object linked to the process is not used up in the processing phase. For example, order templates may be used over and over to provide new orders of a certain style – the templates are not altered or exhausted as part of this activity.
Output
A business process will typically produce one or more outputs of value to the business, either for internal use of to satisfy external requirements. An output may be a physical object (such as a report or invoice), a transformation of raw resources into a new arrangement (a daily schedule or roster) or an overall business result such as completing a customer order.
An output of one business process may feed into another process, either as a requested item or a trigger to initiate new activities.
Resource
A resource is an input to a business process, and, unlike information, is typically consumed during the processing. For example, as each daily train service is run and actuals recorded, the service resource is 'used up' as far as the process of recording actual train times is concerned.
Resources link to Business Processes. An Input link indicates that the attached object or resource is consumed in the processing procedure. As an example, as customer orders are processed they are completed and signed off, and typically are used only once per unique resource (order).
原文出处:
http://www.sparxsystems.com/business_process_model.html