COMMENT :
[houcy]This article is copied from http://www.codeproject.com/KB/debug/XCrashReportPt1.aspx . I found that debugging is an art more than a skill. So no doubtedly , I must learn this kind of art. It`s a powerful weapon to arm myself.
Introduction
One of the biggest challenges for a developer is to debug a program that has been put into production or shipped to a customer. On the developer's workstation, the program works fine. But on the customer's system, there are random crashes. There is often no direct access to the customer's system, because of distance. Writing to the event log or other log file may be helpful, but can only point in a direction, not give a precise location.
This was the state I was in when I read Bruce Dawson's paper on Release Mode Debugging. Dawson's paper discusses several techniques that I had never encountered before, including how to capture the instruction pointer (ip) of a crash, and how to plug the ip into VC++ and go directly to the source line of the crash. (I am talking about VC++ 6.0 here, not .Net).
These new techniques led me toward the holy grail of developers: being able to see a stack trace of each function that led up to the crash. At several points along the way, I thought to myself, "Well, this is pretty complete, there's nothing more to add." But then I would see there was another approach, another API I had overlooked, and I kept on.
Bruce Dawson's Techniques
The key to Dawson's approach is to generate debug symbols for the release build (I will discuss how later on.) Then whenever you release a new version, you archive the pdb file along with the exe file. Here is one thing I did not know: you can open an exe in DevStudio, step into it, enter an ip, and you will immediately be looking at the source line. This is assuming, of course, that you have the pdb file that corresponds with the exe. Oh, yes, and you will need the instruction pointer (ip).
This was the second revelation for me. Tucked away in Dawson's article was a link to some source code that he had published in Game Developer Magazine. The code included an exception handler that captured the ip, system info, and stack at the time of the crash. Best of all, there was also code that could be included in any MFC application, that would automatically call Dawson's exception handler. Here are Dawson's step-by-step directions to add an exception handler to any MFC app:
Preparation
- Set up your release build to generate debug symbols (pdb)
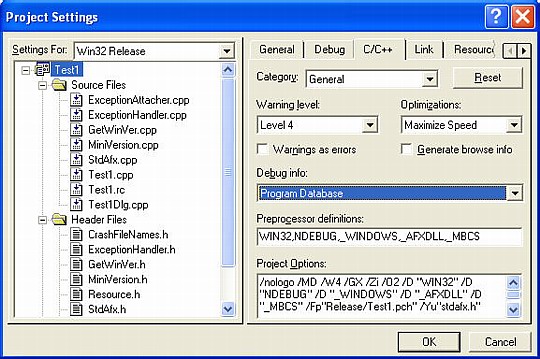
- In your VC++ project, go to Project | Settings. Make sure the Release configuration is selected in the Settings For combobox on the left. Go to the C/C++ tab, select the General category, and select Program Database in the Debug Info combobox. This tells the compiler to generate debug information.
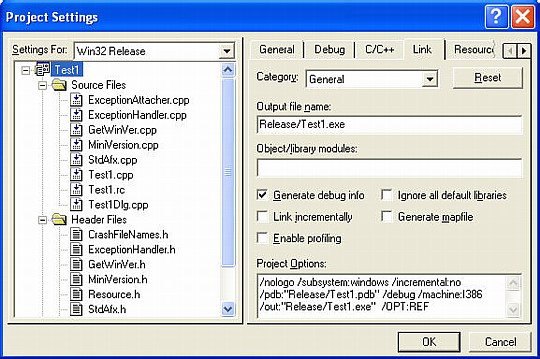
- Go to the Link tab and check Generate debug info. This tells the linker to collate debug information into .pdb files. The linker also puts the name of the .pdb file in the executable, so the debugger can find it.
- On the same Link tab, enter /OPT:REF at the end of the Project Options list. This tells the linker to eliminate functions and/or data that are never referenced. This is the usually the default for release builds, but it gets turned off when you tell the linker to generate debug information. Failing to specify /OPT:REF will cause your executables and DLLs to get 10-20% larger.
- Include these files in your project:
- ExceptionAttacher.cpp
- ExceptionHandler.cpp - should be set to Not using precompiled headers on the C/C++ tab (Precompiled Headers).
- ExceptionHandler.h
- GetWinVer.cpp
- GetWinVer.h
- MiniVersion.cpp
- MiniVersion.h
- CrashFileNames.h
- Recompile the entire project.
Tuck away the exe and pdb files. Do not ship the pdb file to customers - this is both unnecessary and may be helpful to someone wanting to reverse-engineer your program.
Theory Into Practice
When your app crashes, it will now call an exception handler that writes out the ip, system info, and stack to a file called
ERRORLOG.TXT. In the download there is a sample project called
Test1 that demonstrates this use of Dawson's exception handler.
Here is what the first part of ERRORLOG.TXT looks like:
 Collapse
Test1 caused an Access Violation (0xc0000005)
in module Test1.exe at 001b:00402cc0. <=== HERE IS THE IP

Exception handler called in ExceptionAttacher.cpp - AfxWinMain.
Error occurred at 10/18/2003 19:05:08.
D:\temp1\XCrashReportTest\1.1\Test1\Release\Test1.exe, run by hdietrich.
Operating system:  Windows XP (5.1.2600).
1 processor(s), type 586.
32% memory in use.
1024 MBytes physical memory.
687 MBytes physical memory free.
2462 MBytes paging file.
2253 MBytes paging file free.
2048 MBytes user address space.
2033 MBytes user address space free.
Write to location 00000000 caused an access violation.
Context:
EDI:    0x0012fe70  ESI: 0x004043c0  EAX:   0x00000000
EBX:    0x00000001  ECX: 0x0012fe70  EDX:   0x00000000
EIP:    0x00402cc0  EBP: 0x0012f82c  SegCs: 0x0000001b
EFlags: 0x00010246  ESP: 0x0012f820  SegSs: 0x00000023
Bytes at CS:EIP:
c7 05 00 00 00 00 00 00 00 00 c3 90 90 90 90 90
Stack:
0x0012f820: 73dd23d8 004043c0 00000111 0012f85c .#.s.C@.....\...
0x0012f830: 73dd22ae 0012fe70 000003e8 00000000 .".sp...........
0x0012f840: 00402cc0 00000000 0000000c 00000000 .,@.............
0x0012f850: 00000000 0012fe70 000003e8 0012f880 ....p...........
0x0012f860: 73dd8fc5 000003e8 00000000 00000000 ...s............
0x0012f870: 00000000 000003e8 0012fe70 00000000 ........p.......
0x0012f880: 0012f8d0 73dd2976 000003e8 00000000 ....v).s........
0x0012f890: 00000000 00000000 0012fe70 0012fe70 ........p...p...
.
.
.
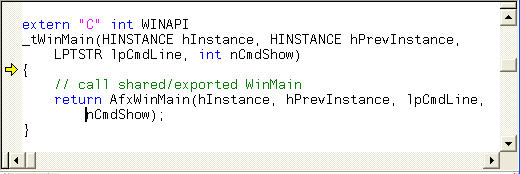
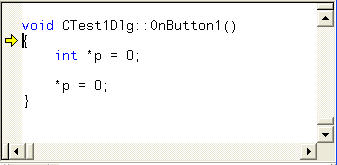
OK, now we have an ip, plus the exe and its pdb file. The next step is to start up DevStudio, then go to File | Open and browse to the release build of your exe (in this case, ..\Test1\Release\Test1.exe). Next click on Step Into (F11). You should now see this:
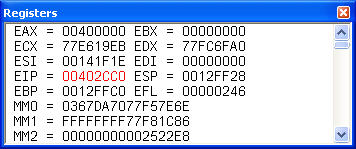
Go to View | Debug Windows | Registers. You will see the Registers window:
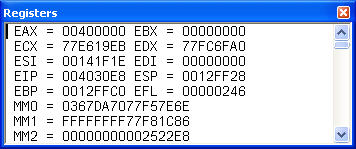
Now click before the hex value of the EIP register and enter the crash ip (from ERRORLOG.TXT, we know this is 00402cc0). You cannot cut and paste - you must type this in. When typing it in, the changed address will be displayed in red:
When you are finished typing it in, hit Enter, and you will see this:
Summary
We have just gone from a crashed app to the (approximate) source line with just one piece of information - the crash
instruction pointer. We have obtained this crash ip fairly simply - without having to modify any existing source code. The cost: the size of the release app (Test1.exe) went from 21 KB to 29 KB. For most commercial apps today, this size differential is insignificant.